
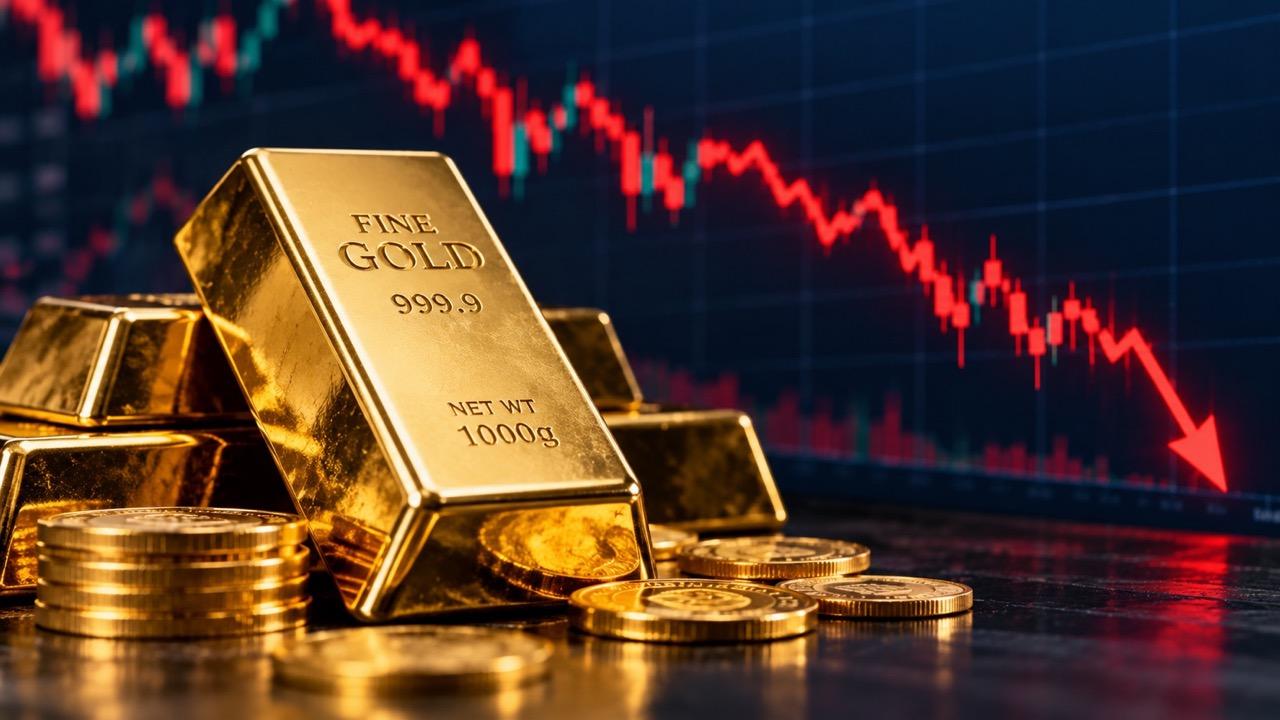
- Gold fell sharply on Sept. 29 as higher Treasury yields, oil-driven inflation concerns and rising Federal Reserve rate expectations pressured the precious metal.
Gold prices suffered their steepest one-day decline in more than two months this week, extending a September selloff that has sharply reduced bullion’s gains from its earlier record highs. According to Yahoo Finance, December gold futures settled at $4,168.40 an ounce on Sept. 29, down 3.54%. Spot gold fell roughly 3.8% during the session, while the SPDR Gold Trust (NYSEARCA: GLD) dropped 3.94% to $377.92.
The decline came as markets repriced interest-rate expectations after oil prices rose and Treasury yields climbed. The 10-year Treasury yield reached about 5.24%, its highest level since 2007. The US Treasury’s official data show the 10-year yield ended Sept. 30 at 5.29%, while the 30-year yield finished at 5.64%.
Gold entered the selloff after a powerful rally earlier in the year. The World Gold Council reported that gold gained 13% in August to finish the month at $4,563 an ounce, supported by strong ETF inflows, futures positioning and options activity.
Why Gold Prices Fell So Sharply
The immediate pressure came from the bond market. Higher Treasury yields increase the relative return available from interest-bearing government securities, making non-yielding gold less attractive at the margin. The move was particularly significant because the benchmark 10-year yield climbed above 5% as markets reassessed the inflation outlook and the potential path for Federal Reserve policy.
The move in oil prices added to those concerns. Rising energy prices can feed into headline inflation and make it harder for inflation to return to the Federal Reserve’s 2% target. The Fed raised its federal funds target range by 25 basis points on Sept. 16 to 3.75%-4%, while stating that inflation remained elevated.
Markets subsequently increased expectations for another rate increase in October. The CME FedWatch pricing put the probability of an October hike at roughly 70% during the gold selloff, up from about 64% the previous day.
The relationship between energy prices and Treasury yields has also been visible across financial markets. Recent Treasury market coverage showed the 10-year yield around 5.21% and the 30-year yield near 5.52% as oil prices climbed.
The dollar provided another headwind. Because gold is priced in US dollars, a stronger dollar can make bullion more expensive for buyers using other currencies. That the dollar remained near a two-month high on Thursday even after softer-than-expected US inflation data reduced expectations for an October rate hike.
The sharp decline also came after substantial investment demand earlier in the year. World Gold Council data show global physically backed gold ETFs attracted $18 billion in August, pushing total assets under management to $615 billion and holdings to a record 4,189 tonnes. World Gold Council’s gold ETF data
That strong positioning provides important context for the speed of the correction. A market that has attracted substantial investment flows can become more sensitive to changes in yields, currencies and monetary-policy expectations.
Gold Market Turns to Jobs Data and Fed Expectations
The gold selloff has not continued at the same pace. Spot gold was around $4,155.60 an ounce, while December US gold futures were near $4,185.50. Softer-than-expected August inflation data reduced the market-implied probability of an October Fed hike to 37% from 45%, although expectations for a December increase remained high.
Gold nevertheless finished September more than 6% lower. The combination of elevated Treasury yields and a relatively firm dollar continues to create pressure even as inflation data provide some relief. The next major test is the US employment report. Markets are watching September nonfarm payrolls and upcoming Federal Reserve commentary for additional clues about the interest-rate path.
Physical and institutional demand will also remain important. World Gold Council data showed China’s central bank bought 20.2 tonnes of gold in August, extending its purchasing streak to 22 consecutive months and taking reported holdings to 2,387 tonnes.
For now, the gold market is being pulled between two forces: strong underlying investment and central-bank demand on one side, and higher yields, a stronger dollar and changing Fed expectations on the other.
The recent silver price pullback shows that the pressure is not limited to gold, with precious metals broadly responding to the shift in rates and currency conditions.
The key market indicators remain Treasury yields, the US dollar, oil prices, and incoming US economic data. A sustained decline in yields could reduce the opportunity cost of holding gold, while renewed inflation pressure could keep rate expectations elevated and extend the pressure on bullion.