
- A $10,000 investment in an S&P 500 index fund could grow substantially over a decade, but the ending value depends heavily on the annual return.
Investors looking at the S&P 500 often focus on its long-term compounding potential rather than trying to predict the return of any single year. The benchmark has historically produced about a 10% average annual return since its 1957 launch, according to Fidelity.
But that historical average does not mean investors should expect 10% every year. Returns can vary considerably from one period to another. For someone investing $10,000 today and leaving it untouched for 10 years, the potential outcome can be illustrated using several annual return assumptions.
What $10,000 Could Become Over 10 Years?
The following examples assume the entire investment remains in an S&P 500-tracking fund and returns compound annually, with no additional contributions, taxes, or investment fees.
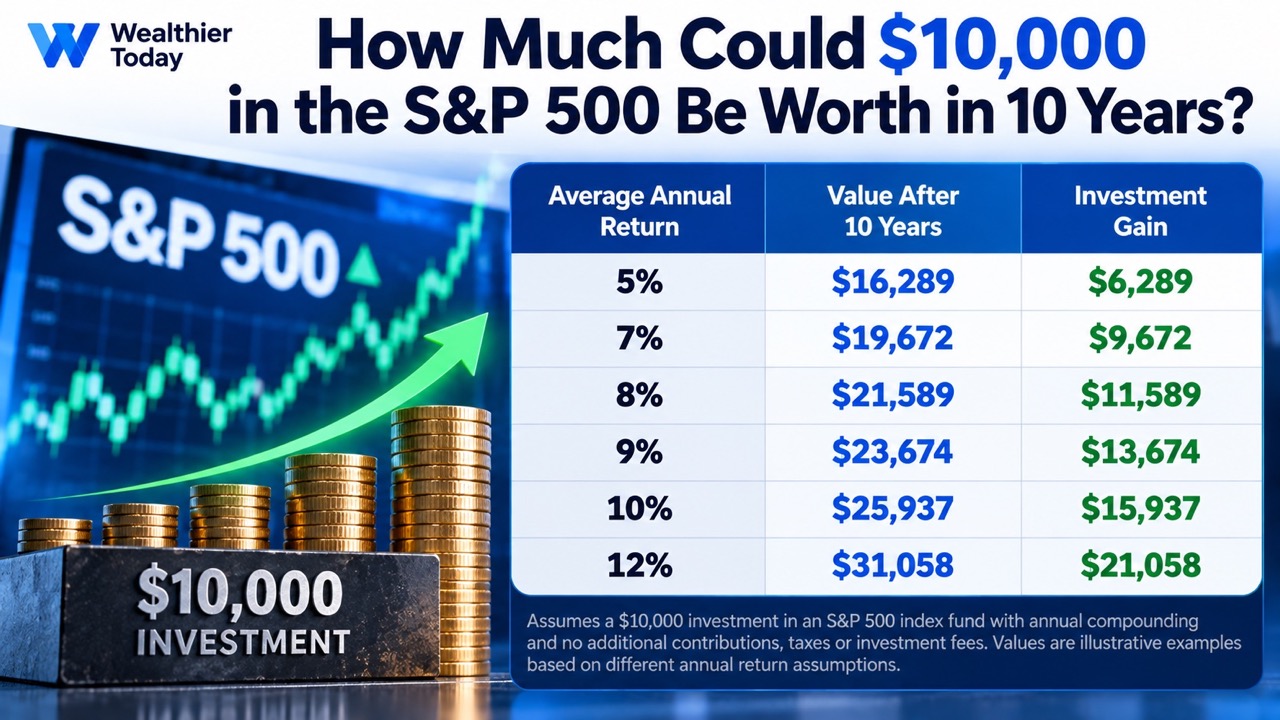
At a 7% annual return, the original $10,000 would grow to roughly $19,672 after a decade. At 10%, matching the approximate long-term historical average cited by Fidelity, the investment would reach about $25,937. A 12% annual return would push the balance above $31,000, although that should be viewed as a hypothetical scenario rather than an expected result.
The calculations demonstrate why the length of time invested can be just as important as the amount initially invested. Each year's return can generate additional gains in subsequent years.
Why the Actual Result Could Be Very Different
The S&P 500's recent performance shows why using a single historical average as a forecast can be misleading. As of Aug. 31, 2026, the S&P 500 had produced a 13.48% annualized price return over the previous 10 years, according to S&P Dow Jones Indices. Its five-year annualized price return was 11.19%.
Those figures describe a specific historical period rather than a guaranteed future return. The difference between price return and total return is also important. Price return measures changes in the index's share prices, while total return accounts for dividends being reinvested. S&P Dow Jones Indices' data show that dividends have historically contributed meaningfully to long-term equity returns.
For investors using an S&P 500 index fund, actual results can also differ because of fund expenses, taxes, and the timing of purchases. Investor.gov notes that investments do not have a set rate of return and that long-term diversified US stock investments are sometimes modeled using annual returns in the 7% to 10% range based on historical averages. That makes the $19,672 to $25,937 range a useful illustration for a 10-year $10,000 investment, but not a prediction.
The bigger takeaway is the effect of compounding. A $10,000 investment does not need to double every few years to become substantially larger over a long period. If returns are positive and remain invested, gains can generate additional gains over time.
For investors considering a 10-year horizon, the eventual value will depend on the market's actual returns during those years rather than its historical average alone.