
The VIX, or Cboe Volatility Index, measures the volatility that S&P 500 option prices imply for the next 30 days, expressed as an annualized percentage. A higher reading means options are pricing larger fluctuations; it does not tell you whether stocks will rise or fall. Cboe's VIX methodology describes the underlying calculation.
For stock market investors, the VIX provides context about near-term uncertainty and the price of protection. Its most useful role is helping you understand risk. Treating it as a precise buy signal, a crash forecast, or an investment you can hold directly leads to very different—and often costly—decisions.
What the VIX Measures and How It Is Calculated
Cboe calculates the VIX using quotations for S&P 500 index options, often identified by the ticker SPX. The calculation combines put and call prices across multiple strike prices and eligible expirations to produce a constant 30-day measure.
The inputs are option quotations, rather than a survey of investor opinions or the stock market's recent percentage change. Cboe uses bid-ask midpoints and interpolates between relevant expiration dates. Its methodology measures time in calendar days, which matters when translating an annualized reading into a shorter period. Read the calculation methodology.
Three distinctions make the headline number easier to interpret:
| Feature | What it means | Common misreading |
|---|---|---|
| S&P 500 index exposure | Measures uncertainty for this broad U.S. stock benchmark | Measures every stock, bond, or cryptocurrency |
| Forward-looking, 30-day horizon | Reflects what current option prices imply | Reports the amount stocks already fell |
| Annualized quotation | Uses an annual scale for a shorter-horizon estimate | Predicts that percentage move next month or next year |
You can understand the number without recreating the full options calculation. Start by keeping its underlying market, horizon, and units separate.
Implied Volatility vs. Realized Volatility
Implied volatility comes from option prices. Realized volatility measures fluctuations that actually occurred over a specified period. Fidelity's explanation of implied and historical volatility distinguishes these forward-looking and backward-looking measures.
Suppose, hypothetically, today's VIX is 24, while the S&P 500's annualized realized volatility over the preceding month was 15%. Those figures answer different questions. The first describes uncertainty priced into options for the coming month; the second describes the previous month's experience.
The gap does not prove that stocks must become more volatile. New information can change expectations, and option prices include compensation for bearing risk. Cboe notes that SPX implied volatility has tended to exceed subsequent realized volatility over long periods. That tendency is often discussed as a volatility risk premium.
It is not a promise of easy profits from selling options. A strategy can collect small gains repeatedly and still suffer a severe loss when an unusually large move arrives. Our risk and reward guide explains why the size and probability of losses matter together.
How to Convert a VIX Reading Into a 30-Day Estimate
A VIX of 20 does not mean the S&P 500 is expected to move 20% in the next month.
A useful educational conversion is:
Approximate 30-day volatility = VIX percentage × √(30 ÷ 365)
This reverses the annualization for the 30-calendar-day horizon. The square-root adjustment reflects variance scaling with time in this simplified framework; dividing the VIX by 12 would be incorrect. Cboe describes the VIX as an annualized standard-deviation measure.
Worked example: VIX at 20 and the S&P 500 at 5,000
Both inputs below are hypothetical:
- Convert the quotation to a decimal: 20 ÷ 100 = 0.20.
- Adjust the horizon: 0.20 × √(30 ÷ 365) ≈ 0.0573, or 5.73%.
- Convert to index points: 5,000 × 0.0573 ≈ 287 points.
- Center an illustrative band around 5,000: approximately 4,713 to 5,287.
Under a simplified normal-return model, a band of roughly one standard deviation corresponds to about 68% probability. Actual returns can be skewed, can have more extreme outcomes than a normal model suggests, and can change their volatility abruptly. Option-implied pricing also is not a literal probability forecast. The band is an aid to interpretation, never a safe-loss limit.
Here is the same calculation at several hypothetical readings:
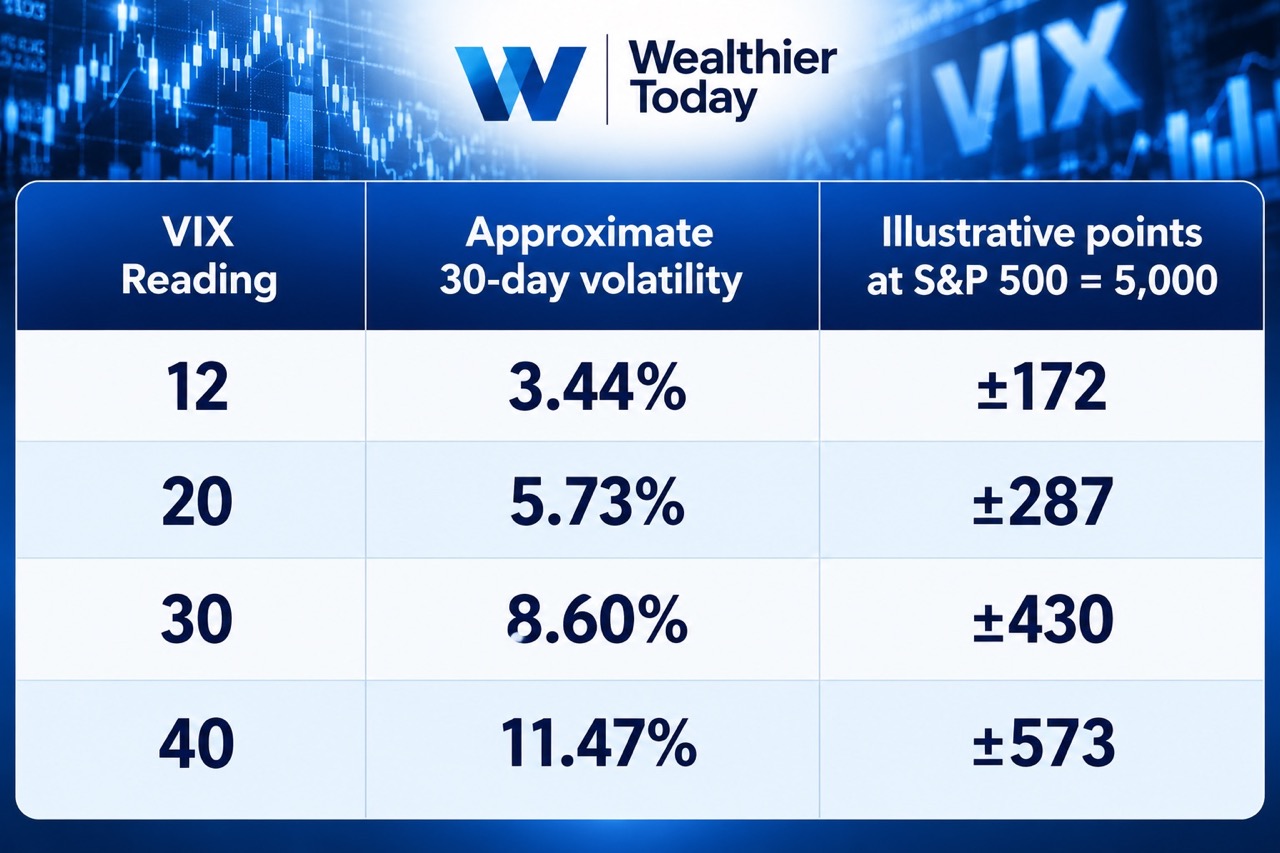
These are examples, not thresholds for trading. The band does not describe the maximum intramonth drawdown, the total distance prices travel, or the return your portfolio will earn. A concentrated portfolio can behave very differently from the S&P 500.
Why Investors Call the VIX the Fear Gauge
The nickname reflects a historical relationship: the VIX often rises when stocks fall sharply. FINRA describes the VIX as generally negatively correlated with the broader stock market.
That relationship makes it useful context during stressful markets, but “fear” is only shorthand. The VIX is a number derived from option prices, not a direct measurement of everyone's emotions.
A rising VIX can accompany a selloff that is already underway. A falling VIX can mean uncertainty is easing without implying that stocks are attractively priced. The index also compresses many possible outcomes into one number: it does not identify which economic event or business problem matters most to your holdings.
For an individual stock, examine its own business risks and options, where relevant. Broad-market calm cannot protect a company from a failed product or an earnings disappointment. Diversification addresses that concentration problem more directly.
Why High and Low VIX Readings Are Weak Timing Rules
There is no universal VIX level that means “buy now” or “sell everything.” Consider three ways a simple rule can fail:
- High does not establish a bottom. A reading of 30 could rise to 40 while stocks keep falling. The original signal does not limit the subsequent loss.
- Low does not establish a top. A reading of 12 could persist while businesses grow and share prices rise. Waiting indefinitely for a spike has an opportunity cost.
- A correct volatility view can still produce a losing trade. You might anticipate a VIX increase yet buy a derivative whose price already reflects that expectation.
These are hypothetical counterexamples, not a backtest. They show why a rule needs more than an appealing story.
Anyone evaluating a VIX-based strategy should specify entry and exit rules, test multiple market environments, and account for transaction costs and taxes. Use prices of the actual instrument being traded; a chart of the spot VIX cannot establish the returns of an investable strategy.
Long-term savers can instead define contribution and rebalancing rules before volatility rises. Our investment strategies guide explains how to build that process around your goals and allocation.
The VIX Index, Futures, and Volatility Funds Are Different
You cannot buy the spot VIX directly. Volatility-linked products generally obtain exposure through derivatives, and futures do not move one-for-one with the headline index. FINRA's volatility investing guidance emphasizes this distinction and the risks of using such products as long-term holdings.
| Instrument | What the exposure involves | What to check |
|---|---|---|
| Spot VIX index | A calculated market measure | Horizon and quotation units |
| VIX futures | Exposure associated with a future settlement date | Expiration, settlement terms, margin, and contract size |
| VIX options | A derivative payoff tied to VIX settlement | Strike, expiration, premium, and settlement mechanics |
| Volatility-linked ETF or ETN | A specified derivative strategy or benchmark | Prospectus, futures maturities, rolling method, fees, and any leverage |
Why the futures curve matters
When later-dated futures trade above nearer-dated contracts, the curve is in contango. The opposite arrangement is backwardation. Cboe's discussion of the VIX futures curve explains these configurations and why the curve is not a dependable forecast of stock returns.
For a simplified example, suppose a futures contract costs 24 when a strategy adds exposure. Later, that contract trades at 21. A long position loses 3 points, or 12.5% of the initial quoted futures level, before other effects. That percentage is not the return on margin posted or the return of a fund.
The spot VIX could be unchanged over the same interval. The futures position still lost value. Repeated exposure to contracts that decline as they approach expiration can create a drag on a rolling strategy. Buying the next contract does not itself manufacture a loss; the subsequent price path matters.
Before buying any volatility product, write down its benchmark, intended holding period, maximum affordable loss, and exit rule. If you cannot explain how its return could diverge from the VIX, review its prospectus with a qualified adviser before committing money.
How Stock Investors Can Use the VIX Practically
The same VIX reading can mean different things for investors with different cash needs.
| Your situation | Useful response | Decisions the VIX cannot make |
|---|---|---|
| Saving for retirement decades away | Check whether your allocation remains tolerable | Whether to suspend every contribution |
| Paying a known expense soon | Verify the money is available without selling stocks | Whether a rebound will arrive before the bill |
| Holding a concentrated stock position | Review company-specific downside and position size | Whether broad-market calm makes the stock safe |
| Considering a hedge | Compare its cost, horizon, and payoff with the exposure | Whether any product labeled “volatility” will offset losses |
| Using borrowed money | Assess cash requirements under a larger decline | Whether the current reading caps future volatility |
Imagine two people each hold $100,000 in stocks. One has stable income, separate emergency savings, and no withdrawals planned for 20 years. The other must withdraw $20,000 for tuition in six months. Their holdings and the VIX quotation are identical; their ability to absorb a downturn is not.
The second investor's cash deadline deserves attention even when the VIX is low. The first investor might reasonably keep following an established dollar-cost averaging plan, assuming the underlying allocation still fits.
Write down three things before reacting to the next VIX headline: when you need your investment money, how much decline your plan can withstand, and what specific event would trigger rebalancing. For ongoing withdrawals, the portfolio runway calculator can help explore spending assumptions. Keep those longer-term scenarios separate from a 30-day options-market reading.
Frequently asked questions
What does a VIX of 20 mean?
A VIX of 20 represents 20% annualized implied volatility for the S&P 500 over the next 30 days. Scaling by the square root of 30 divided by 365 gives roughly 5.73% for that 30-day period. This is an illustrative volatility measure, not a guaranteed trading range or a predicted decline.
Is a high VIX good or bad for investors?
A high VIX indicates that S&P 500 options imply larger near-term fluctuations. That can matter for cash needs, leverage, and hedging costs, but it does not establish whether stocks are cheap or whether a recovery is imminent.
Can you buy the VIX directly?
No. The spot VIX is an index calculation. Futures, options, and volatility-linked exchange-traded products provide different forms of exposure, with prices and returns that can differ substantially from changes in the headline index.
Does the VIX predict a stock market crash?
No. The VIX reflects option-implied volatility over a 30-day horizon, without specifying the direction of stock returns. It can rise after a selloff begins, remain elevated during a recovery, or be low before an unexpected shock.
Is the VIX the same as volatility for an individual stock?
No. The VIX uses S&P 500 index options. A company's earnings announcement, financing problem, or other business event can create substantial individual-stock risk even when broad-market implied volatility is low.
Continue reading
More resources
- InvestingWhat is Investing?Saving helps you achieve your financial goals. Investing helps you grow your savings.Read next
- InvestingBest Investment Strategies for 2026This guide compares the best investment strategies for beginners and long-term investors, including index investing, asset allocation, dollar-cost averaging, rebalancing, value, growth, dividend, and active investing.Read next
- InvestingRisk vs. Reward: Meaning, Ratio and ExamplesLearn how risk vs. reward works, how to calculate a risk-reward ratio, and how to decide whether an investment's potential return is worth the risk.Read next
- MoneyWhat Is Wealth Management? Services, Fees, and How It WorksWealth management is holistic financial planning for people with complex finances—covering investments, taxes, estates, retirement, and risk. Learn services, typical fees, asset minimums, and how to choose a fiduciary.Read next