
XRP's price action is bleeding out on the charts, but beneath the surface-level pain, datasets are pointing to conviction from the traders who hold XRP, and another steady, deliberate accumulation from institutions that are quietly buying XRP compared to other large cryptos.
XRP’s Decline Did Not Cause A Full-Leverage Collapse
XRP's price has fallen below $1.20, shedding 9.1% of its value in the past seven days. This XRP selloff was not painless for bullish traders, but it also did not produce the type of derivatives wipeout that often accompanies a major breakdown.
Whenever a cryptocurrency drops that much in a week, the typical expectation is a liquidation cascade of overleveraged positions blown out on both sides, panic in the derivatives market, and a self-reinforcing sell-off.
However, liquidation data shows that even though the XRP price recently fell by 3% in a single session, traders refused to panic. Particularly, total liquidations on XRP over that 24-hour period reached just $1,924,310, a figure that, in the context of a 3% decline, is very low.
Long positions accounted for $1.79 million, or 92.92% of the total, while short liquidations stood at only about $136,291. That imbalance shows that traders positioned for a rebound absorbed most of the damage as XRP moved lower.
The overall size of the liquidations is more interesting than the long-short split. Liquidation activity is currently only 0.39 times XRP’s seven-day average and just 0.05 times its recent 30-day peak. In other words, XRP fell, but the market did not appear to be hit by widespread panic or deleveraging.
Positive Inflows Into Spot XRP ETFs
There's a current divergence in price action and institutional XRP inflow numbers that cannot be ignored. Data shows that Spot XRP ETFs are the only crypto ETFs to record net inflows on the first trading day of the week, with $5.31 million in net inflows on Monday, June 22. Bitcoin Spot ETFs, meanwhile, posted $68.18 million in net outflows, while Spot Ethereum ETFs saw $66.04 million leave their funds.
The difference is particularly notable because XRP’s price is currently not outperforming Bitcoin or Ethereum. However, the flow data shows that investors are pouring capital into regulated XRP funds even with price action moving lower.
XRP’s price structure has deteriorated throughout June, with the cryptocurrency falling from above $1.30 earlier in the middle of the month to $1.10 at the time of writing. Data from CoinGecko shows XRP recently touched intraday lows around $1.09, making the current range at $1.10 an important support to hold on to.
A long-term technical view shared by crypto analyst Tom on X proposes that the current pullback may be a back-test of a much larger breakout structure. The weekly XRP chart shared by the analyst pointed out a massive symmetrical triangle that has been forming for almost nine years.
The triangle’s upper trendline goes back to XRP’s 2017 peak, while the rising lower support line begins around the 2020 low and moves upward into 2026. XRP briefly broke above the long-term descending resistance line during its surge into 2025, rising to a new peak at $3.65, before giving back much of that advance.
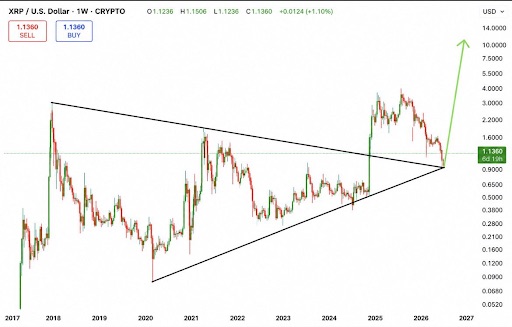
XRP is now retesting the peak of that triangle and needs to hold above it. Tom believes a bounce from here could eventually produce a large upside rally, with an $8 to $10 XRP price target before it moves into genuine price discovery.
Market activity
XRP
Market data and charting provided by TradingView. Data may be delayed depending on exchange availability.